Project Management & Planning
Thomas Cummings - 10th May 2024
A successful research project requires a strong level of planning and as such a variety of project management techniques were initially implemented. A paper by Kumar (2005) stated that “most projects share common activities, including breaking the project into easily manageable tasks, scheduling the tasks, communicating with the team, and tracking the tasks as work progresses.” In this blog post, each of these activities and the way in which it is managed through the research project will be discussed individually.
Breaking the project into easily manageable tasks
The initial project development stage focused on selecting the broad research project objectives using a brainstorming activity to consider and make decisions regarding the scope of the project, intended deliverables, required resources and general approach to the research. This initial brainstorming activity was based on four rules set out by Alex Osborn which advise to “(a) generate as many ideas as possible; (b) prioritize unusual or original ideas; (c) combine and refine the ideas generated; and (d) abstain from criticism during the exercise” (Chamorro-Permuzic, 2015). Overall this allowed for rapid idea generation and supported unrestricted creativity in problem solving which then required further research and consideration to combine and produce a project proposal. The required activities for the research project could then be extracted through the development of a work breakdown structure (WBS) which is “a deliverable-oriented hierarchical decomposition of the work to be executed by the project team to accomplish the project objectives and create the required deliverables.” (PMBOK Guide, 2001). For this research project the deliverable is the canine body condition scoring system along with the accompanying research paper on the application of machine learning techniques in this field to support the project hypotheses. Further information on the project aims and objectives can be found here. This deliverable makes up the highest layer of the WBS which could then be broken down as “a family tree subdivision of a program, beginning with the end objectives and then subdividing these objectives into successively smaller end item subdivisions” (NASA, 1962). The WBS for this project is shown in figure 1 and the defined objective is first broken down into the broad principal activities of planning, data collection, data preprocessing, modelling and report before being further subdivided into the work packages and then again into the individual activities. Given the relatively straight forward nature of the project it was decided that this four layer fairly shallow approach was sufficient whilst still allowing an element of freedom in managing the individual activities to allow for natural development of the project without micro management of tasks from the outset. Having said this, it is important to consider that whilst the depth of information within the WBS is subjective, it “is supposed to reflect the total scope of work involved in the project. Capturing the total work and efforts required for the project is most important, as WBS is the source for project cost estimations, schedule planning, and risk mitigation.” (Sharon & Dori, 2012)

Figure 1 - Work Breakdown Schedule (WBS)
Schedule the tasks
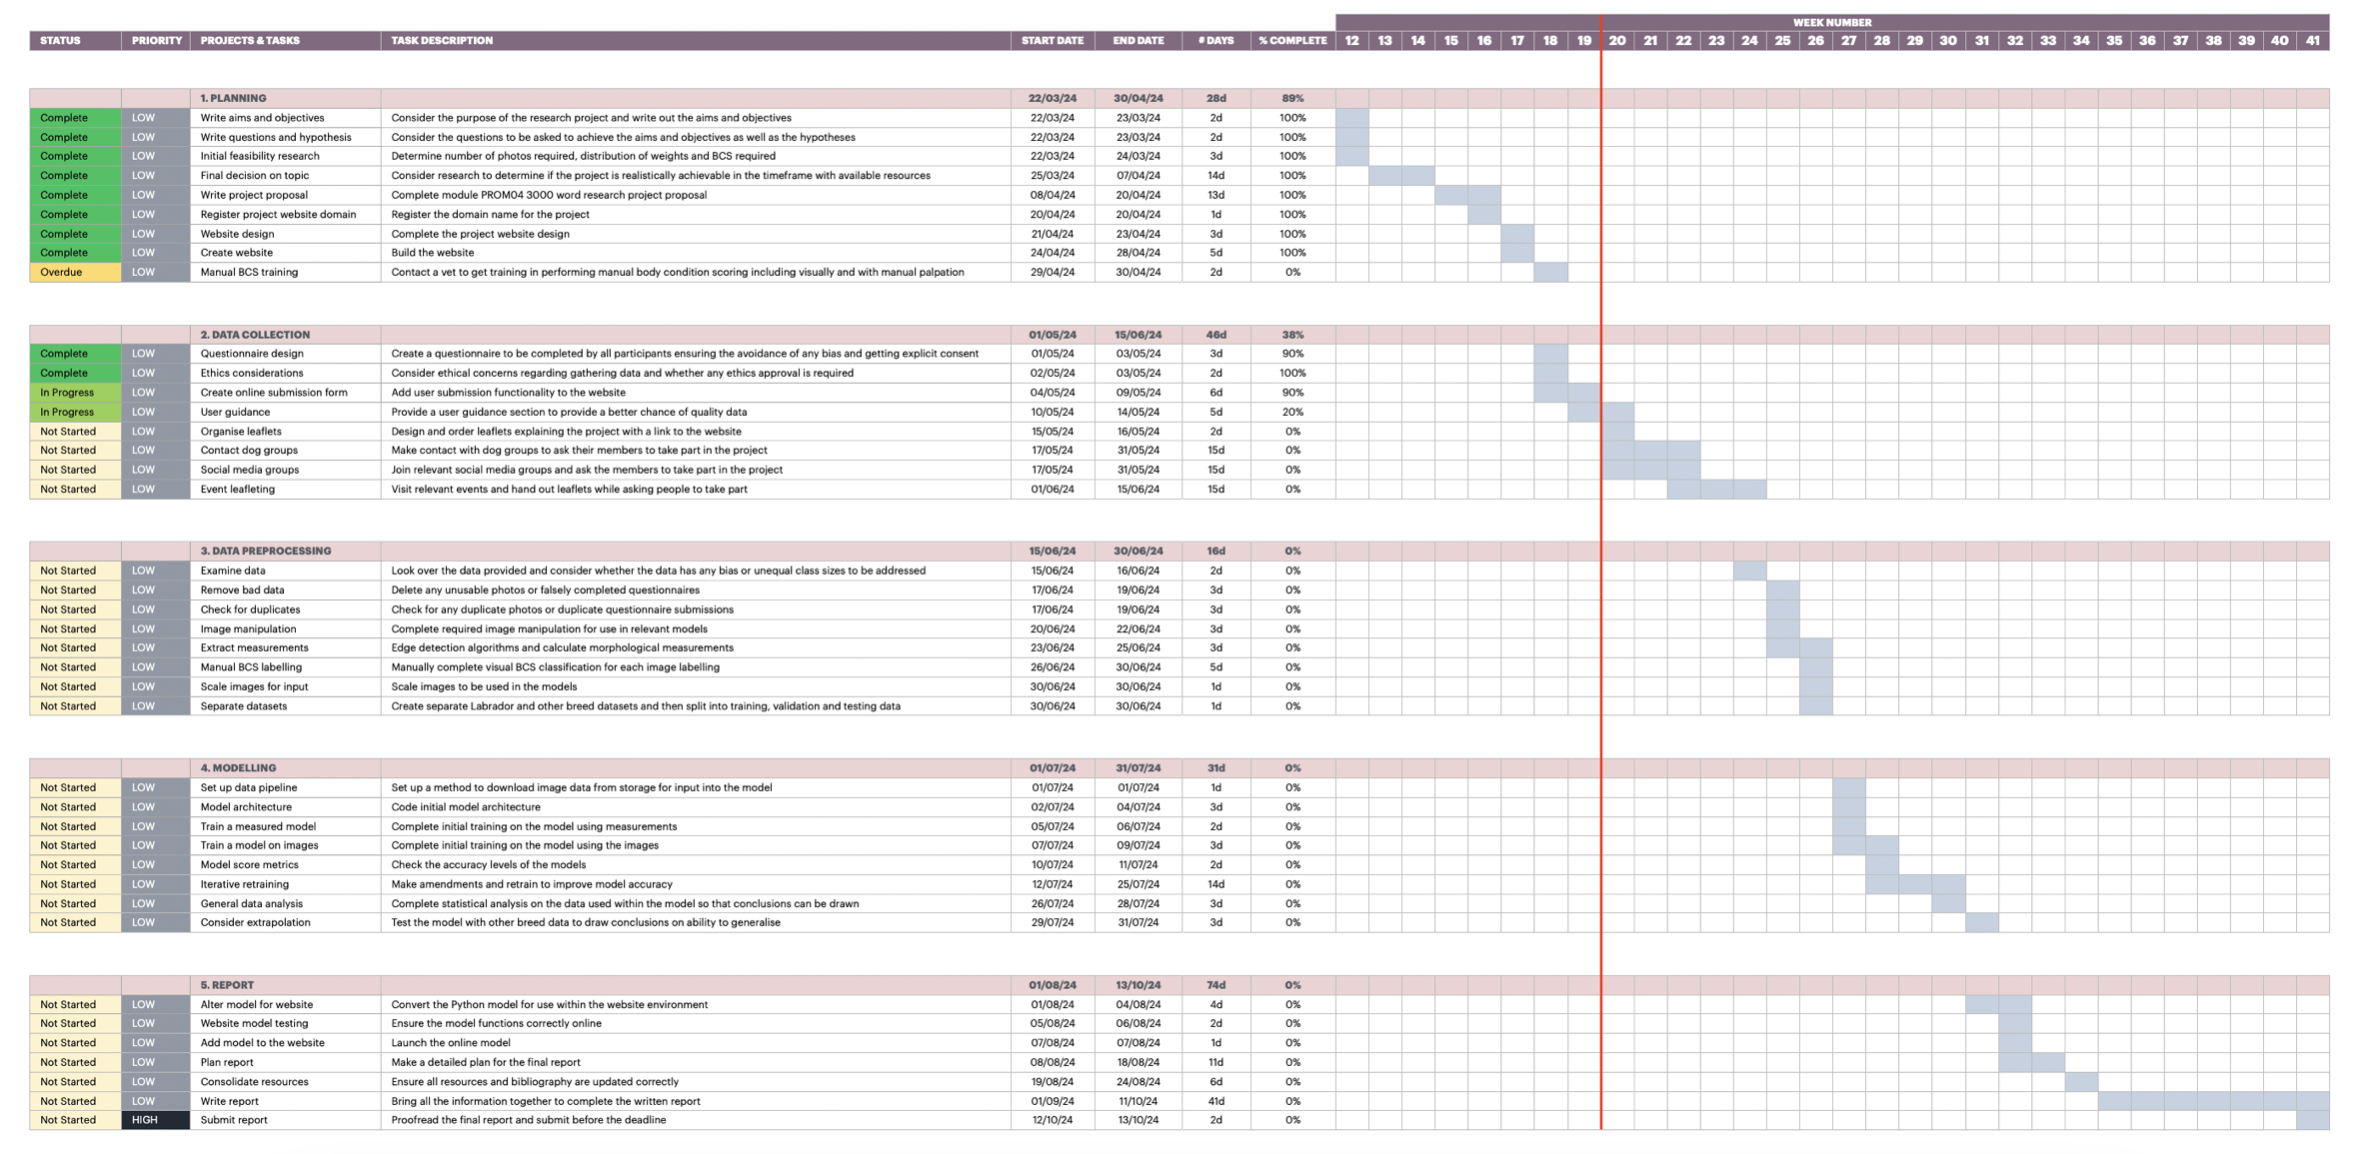
The project management triangle provides three key focus areas for a project as time, cost and scope. The scope was considered during the initial brainstorming stage and the cost element is less significant for this research project given the minimal budget concerns and costing requirements. On the other hand, this research project has a focus on meeting time specific targets and as such planning the timeframe is a key objective and KPI to be managed throughout the project lifetime and as such a Gantt chart provides an ideal solution for scheduling and monitoring. There is some criticism of the use of Gantt charts by project managers as they “may promote a project management that is overly preoccupied and focused on time over other relevant aspects involved in managing a project, such as the value creation and realisation, development of relationships, exploitation of opportunities” (Geraldi & Lechler, 2012). As stated previously this isn’t a major concern for this research project given that the time focus is a priority due to the fixed deadline that must be achieved. Whilst more complex project management tools and strategies are available it was decided that the Gantt chart would be sufficient for the task as it provides a “simple, intuitive, practical and useful visual representation of project activities and durations” (Geraldi & Lechler, 2012). It was also relatively quick to create using standard office spreadsheet software which is important given that the time spent on planning must be proportionate to the overall project requirements. This relative simplicity stems from the ability to extract the relevant activities from the existing WBS to create the schedule although there can be some difficulty in accurately forecasting time blocks for some tasks. The condensed weekly Gantt chart in figure 2 shows how the chart is arranged in sections matching the WBS principal activities which are then further subdivided into the individual activities. This works well for the project given that there is a strong sequential process whereby tasks must generally be completed before the next block can begin. An example of this is the overdue task which will need to be completed before data preprocessing begins and in particular before the manual BCS labelling activity can be completed. This overdue task is clearly highlighted by the Gantt chart with a colour coded traffic light system to demonstrate the importance of these tasks.

Figure 2 - Gantt Chart
Communicating with the team
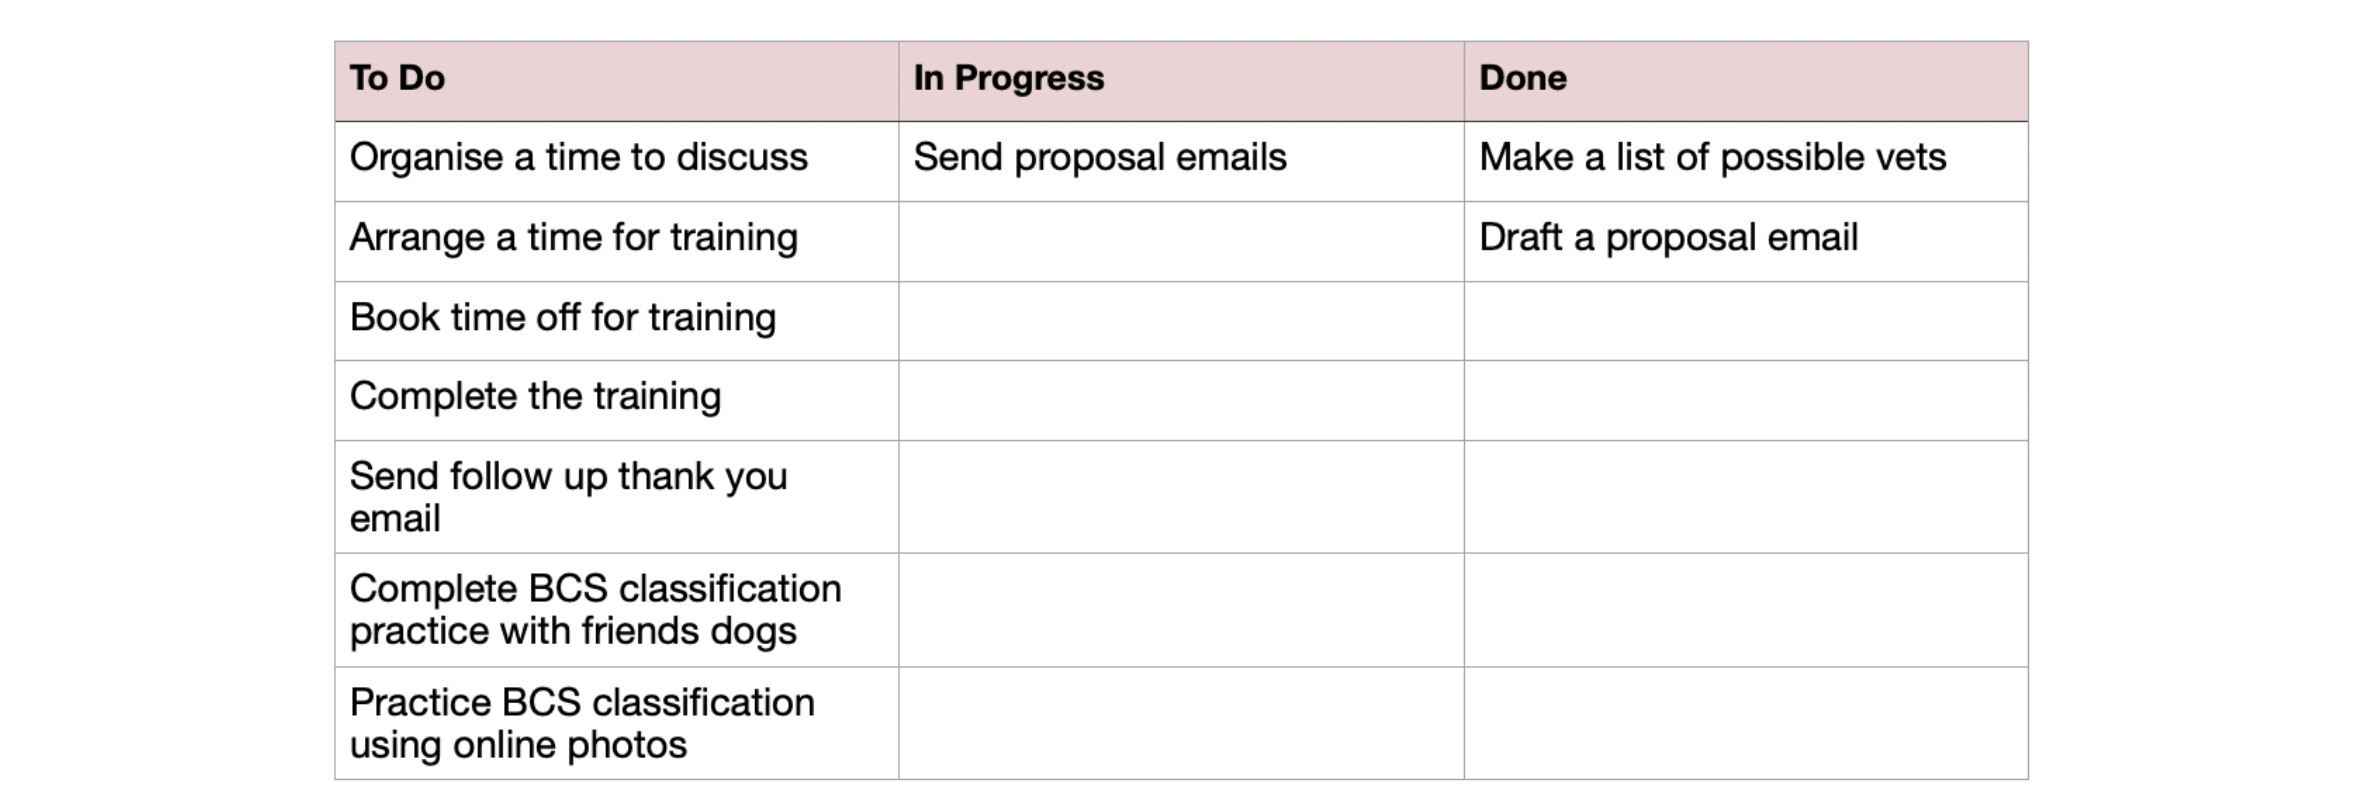
As this is an individual research project there is no team for ongoing communication and as such this does provide a possibility for the project to go off track given the lack of accountability that a team would naturally provide. As a result the Gantt chart fulfils the objective as a document central to the project timeline as it provides a method for monitoring project objectives and activities to stay on track. The individual nature of the project and linear flow of tasks means that a waterfall methodology approach is most suitable as “traditional project management use[s] a methodical, sequential approach to reach a desired target or outcome” (Wingate, 2014) as opposed to flexible project management approaches such as the Scrum agile method which is more suitable for cyclical projects requiring iterative approaches. Despite this, some elements of agile methodologies can be adapted and implemented in the daily activities of the project such as the use of a Kanban board. This allows the individual elements of an activity to be further broken down into individual parts whilst actively managing the current workload to complete the activity. An example Kansan board for the overdue task in the Gantt chart is shown in figure 3 however some tasks would be better written as SMART objectives to ensure they can be achieved.

Figure 3 - Kanban board
Tracking the tasks
Regardless of how carefully and methodically the research project is planned, it can only be successful if the documents are reviewed and updated regularly. While the WBS as the basis for the scheduling isn’t updated during the project unless there is a change to the deliverable scope, the Gantt chart on the other hand is reviewed at least weekly to ensure compliance with the plan and to allow for creation of each Kanban board. Further information regarding measuring the project success can be found here here. This requirement for regular review of the document throughout the project lifecycle is another benefit of the simplicity of the Gantt chant as it can quickly and easily be updated. It also shows at a glance the current state of the project including any scheduling conflicts and bottleneck periods as well as any additional capacity that becomes available. These regular updates are also important given the general difficulty in accurately forecasting and scheduling task time allocations meaning that some tasks may be completed more quickly or overrun and therefore requiring ongoing adjustments. Overall this simplicity supports why the Gantt chart was chosen instead of a PERT chart, not only because the linear aspects of the project meant there were fewer interdependent tasks but also because the ease of use encourages ongoing active use of the document. This “active management of the plan, including change management, risk management, performance measurements, and communications” (Wingate, 2014) ensures that any issues especially regarding meeting the project deadline should be noticed and dealt with early to avoid failing to meet the project requirements.
References
Chamorro-Premuzic, T. (2015). ‘Why group brainstorming is a waste of time’, Harvard Business Review. Available from https://hbr.org/2015/03/why-group-brainstorming-is-a-waste-of-time Geraldi, J. & Lechler, T. (2012). ‘Gantt charts revisited: a critical analysis of its roots and implications to the management of projects today’, International Journal of Managing Projects in Business’, 5(4), pp. 578-594. https://doi.org/10.1108/17538371211268889 Kumar, P.P. (2005). ‘Effective use of Gantt chart for managing large scale projects’, Cost Engineering, 47(7), pp. 14-21. Available from: https://www.proquest.com/openview/72672e5266e73976dcac3c515234115e/1?pq-origsite=gscholar&cbl=49080 (accessed 10 May 2024). NASA (1962). ‘DOD and NASA Guide: Pert Cost’, Pert Coordinating Group. Available from https://mosaicprojects.com.au/PDF-Gen/DOD_and_NASA_Guide_PERT_Cost_Output_Reports.pdf PMBOK Guide (2001). ‘A guide to the project management body of knowledge: PMBOK Guide’, 3rd edn. Sydney: SAI Global Ltd Sharon, A. & Dori, D. (2012). ‘A model-based approach for planning work breakdown structures of complex systems projects’, IFAC Proceedings, 45(6), pp. 1083-1088. https://doi.org/10.3182/20120523-3-RO-2023.00255 Wingate, L.M. (2014). ‘Project management for research and development: guiding innovation for positive R&D outcomes’, London: Auerbach Publishers, Incorporated
Back to Blog